Showing posts with label Sharing. Show all posts

Saturday, 9 May 2020

Easy Trick to See Trend Clearly

There are many types of way to plot price in the chart.

Example:
Candles
Bars
Line
Heikin Ashi
Renko
Kagi
Point and Figure

So which chart are you using?

Commonly, I think people are using bars and candles.

Today, I going to share with you a type of chart which easy to see the trend and allow you to take prompt action without any extra indicator.

Before that, lets see few examples first.

Candle Chart

Line Chart

Bar Chart

Heikin Ashi Chart

Among above 4 charts, which chart is the most easier to read and with the least noise?

The answer is very easy right?

Line chart.

However, can line chart help you to make fast decision to enter/exit position?

Line chart can help you make decision during breakout happening but before breakout happen you might facing problem hard to make decision.

Heikin Ashi (HA) Chart is the one that i refer to easy to spot the trend and can help you to make fast decision to enter/exit position depends on how you use it.

So from above HA Chart what can you see?

At here, Green HA Candle is up candle while Red HA Candle is down candle.


When price is the moving up, you can see green candle is more than red candle.

While for price down movement, you can see red candle is more than green candle.

Another benefit of this HA Chart is you can easily spot the beginning and ending of the retracement.

HA Chart is good in helping you enter and exit position in trading.

Below are the platform that you can use to see Heikin Ashi Chart:
TradingView
Investing.com

At here I will show you how to do it at TradingView.

Step 1 go to www.tradingview.com

After that follow the below picture steps:


After you completed above steps, your chart now will be HA Chart.

Thank you for your reading, hope this can help you.

If this really help you, share it with you friend and like our FB page:
https://web.facebook.com/MasketeerTafaInvest/

Join our Telegram Channel for latest update as well:
https://t.me/MasketeerTafaInvest

If you don't want to miss out any of our sharing, visit our blog and subscribe the Follow by Email:
https://tafainvest.blogspot.com/

Have a nice day.

Disclaimer:

All posts and documents submitted/posted by the Admin in this blog are solely for sharing and education purposes only. All recommendations, opinions and sharing provided by the Admin are solely for your consideration only and you should exercise your own judgement in forming your own investment decision(s). Please also be informed that all kind of investments have risks and we recommend you to conduct sufficient searches for information in addition to referring our recommendations, sharing  and/or opinion herein, prior to making any investment decision(s).

You should take full responsibility of your investment decision(s) and we accept no liability whatsoever for any direct or consequential loss arising from any use of our recommendations, sharing and/or opinion provided herein or any solicitations of an offer to buy or sell any securities. Information from this blog forwarded/shared/provided by member/follower/reader/subscriber of this blog do not belong to Admin and we take no responsibility of such

Thursday, 7 May 2020

How patience can help you in trading?

Usually, when there is a trading setup available in chart people will immediately want to enter a trading position.

This kind of reaction is fear of missing out trade.

When a trading setup appeared just a precondition before taking a good trade. There are still plenty of steps need to do and checking about this trading setup is having a good chance of winning or bad chance of winning.

Since non of us can guarantee what going to happen in future so the best we can do is aim for the opportunity with the highest chance to win. Or will you aim for the bad opportunity? (I think no one will go for this option when come to investment and trading)

Our goal is very clear in investment, make money.

Therefore, take action to increase the odd of winning instead of follow trading setup blindly.

Why people using fundamental analysis, technical analysis, sentimental analysis, etc...?

By doing analysis we can increase our confidence as well as reduce the risk.

Below I will use moving averages crossover and stochastic to show you the example Patience vs FOMO.


Chart 1

From above chart, can you see the difference between the entry timing for 1 and 2?

For above scenario 1, one of the most widely used trading setup is 2 moving averages crossover. When the crossover occurred, many people that follow the signal blindly will go in directly or because of fear of missing out trade.

However, when you cross check with Stochastic it tells you that currently the price is overbought. How will this interpretation help you?
Moving averages show you the trend changed from down to up while Stochastic informs you that price might going down due to overbought.
Would it be better if you wait for everything to favour you before enter a trade?
Here is the difference between the patience and impatience people.

If you don't pay attention enough about this little detail, after you bought in at 1. 
What happened to the price movement?
The price not really going up just some sort of moving sideway.

On the other hand if you wait for the Stochastic to tell you the price is oversold and potentially turn up while the overall picture of the price is still up based on moving averages. When you enter at 2, the market start to move up nicely within a short period of time and get to avoid paper losses in this scenario compare to scenario 1.

Scenario 1 and 2 different by:
Price: 4.26% 

By taking position at 2, you will gain extra 4.26% compared to 1.

You want 1 or 2? 

Make you choice.

Thank you for your reading, hope this can help you.

If this really help you, share it with you friend and like our FB page:
https://web.facebook.com/MasketeerTafaInvest/

Join our Telegram Channel for latest update as well:
https://t.me/MasketeerTafaInvest

Have a nice day.

Disclaimer:

All posts and documents submitted/posted by the Admin in this blog are solely for sharing and education purposes only. All recommendations, opinions and sharing provided by the Admin are solely for your consideration only and you should exercise your own judgement in forming your own investment decision(s). Please also be informed that all kind of investments have risks and we recommend you to conduct sufficient searches for information in addition to referring our recommendations, sharing  and/or opinion herein, prior to making any investment decision(s).

You should take full responsibility of your investment decision(s) and we accept no liability whatsoever for any direct or consequential loss arising from any use of our recommendations, sharing and/or opinion provided herein or any solicitations of an offer to buy or sell any securities. Information from this blog forwarded/shared/provided by member/follower/reader/subscriber of this blog do not belong to Admin and we take no responsibility of such.

Wednesday, 29 April 2020

Good Signal Vs Bad Signal (Fake Signal)

Many people do well in up market but not very well during down market.

Do you ever think why is this happening?

In technical analysis, one of the main pillar is market moves in trend.

From this aspect, we need to know market is uptrend, downtrend or sideway.

Why many people do well in up market?

Because during up market, up space is more than down space.


Figure 1

Green colour vertical line represent the up movement price distance.

Red colour vertical line represent the down movement price distance.

During uptrend, up movement price distance is MORE THAN down movement price distance.

Green line is LONGER than Red line.

While for down market, down space is more than up space.
Figure 2

During downtrend, up movement price distance is LESS THAN down movement price distance.

Green line SHORTER than Red line.

When you understand the characteristics of trend, then you can save lots of money.


Next let's see Good signal vs Bad signal.

During uptrend, many indicator give good signal and good entry.

Below example is used the most widely used indicator RSI.


Chart 1

For chart 1, RSI given 3 oversold signals if buy at that moment which are 100% winning rate as after entered position price start to move up.

In uptrend, you can blindly follow the indicator buy signal and mostly can earn profit without much problems.

This is because up space more than down space.


However when come to downtrend market, indicator buy signal can be a nightmare.


Chart 2

In this downtrend chart, RSI got 8 oversold signals. If we followed all these buy signals, got 5 signals after entered position price still moving down and some of them evening move down steeply.

3 of  8 buy signals can earn profit.

5 of  8 buy signals is Bad signal or so called FAKE SIGNAL which can make you lose money.

Therefore, many buy signals from indicators work well in uptrend but not in downtrend.

If you know when to buy and when NOT TO BUY, your stock return would be awesome.

Learn how to see the trend and follow the trend.

Hope this can help you improve your stock return on investment and avoid the TRAP.

To join our telegram channel, click below link
https://t.me/MasketeerTafaInvest

Like us on FB:
https://www.facebook.com/MasketeerTafaInvest/

Thank you for your reading.

Have a nice day.

Disclaimer:

All posts and documents submitted by the Admin in this blog are solely for open discussion and education purposes only. All recommendations and opinion provided by the Admin are solely for your consideration only and you should exercise your own judgement in forming your own investment decision(s). Please also be informed that all kind of investments have risks and we recommend you to conduct sufficient searches for information in addition to referring our recommendations  and/or opinion herein, prior to making any investment decision.

You should take full responsibility of your investment decision(s) and we accept no liability whatsoever for any direct or consequential loss arising from any use of our recommendations and/or opinion provided herein or any solicitations of an offer to buy or sell any securities. Comments and opinions forwarded/shared/provided by members/followers/readers of this blog do not belong to Admin and we take no responsibility of such.

Saturday, 25 April 2020

Less than 10 Seconds Stock Checking Method

There are plenty of ways to check a stock is good or not.

Some of those ways need lots of experience and efforts before you can really apply it efficiently. 

Fortunately, there is a most easier way to check your stock with less than 10 secs time.

Before you want to use this method, you need to have access to stock price chart.

There are many platforms you can access to see stock price chart.

Example:
including your broker platform charting system

Today we will show you how to access to a stock price chart and check your stock within 10 seconds.

We going to use google to do it.

1st Step:

If you holding a share, example Facebook Inc.

Just go to www.google.com and search the company share price.

For Facebook Inc., just type "Facebook Share Price"

Figure 1

2nd Step:

Click "Max" after you see the share price chart.

Figure 2

3rd Step:

After clicked "Max", the chart will shows the share price from beginning until latest price.

Figure 3

Easy right?

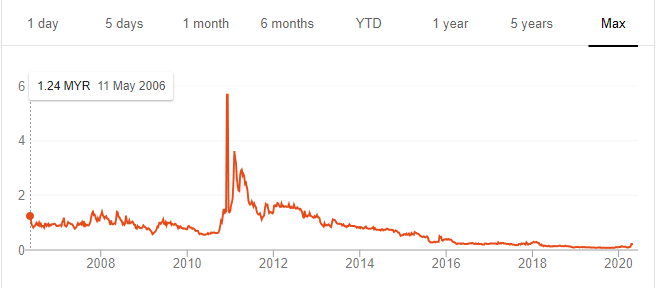
Now let us see some stock price chart examples.


Chart 1


Chart 2


Chart 3

Based on above 3 Charts, which stock will you choose to buy, sell or hold.

This is EASY right?

Now if you holding a stock that is same as Chart 1, what should you do?

If you looking a stock which similar with Chart 2, would you invest in it?

So now everything is very clear, right?

Without referring to pro, you also know what to do.

Hope this will give a you clear direction.

Thank you for you reading.

Have a nice day.

Disclaimer:

All posts and documents submitted by the Admin in this blog are solely for open discussion and education purposes only. All recommendations and opinion provided by the Admin are solely for your consideration only and you should exercise your own judgment in forming your own investment  decision(s). Please also be informed that equity investment is risky and we recommend you to conduct sufficient searches for information in addition to referring our recommendations and/or opinion herein, prior to making an investment decision.

You should take full responsibility of your investment decision(s) and we accept no liability whatsoever for any direct or consequential loss arising from any use of our recommendations and/or opinion provided herein or any solicitations of an offer to buy or sell any securities. Comments and opinions forwarded/provided by members/followers of this blog do not belong to the Admin and we take no responsibility of such.

Thursday, 23 April 2020

Common Question: "What stock to buy?"

Today let us discuss about this question that we can heard about it all the time.

When come to financial instruments, we need to know: why to use it and how to use it.

WHY??????
What is your intention of using this financial instrument to make money?
Trading?
Investment?
We must have a clear mind about this before enter the market.
So know your purpose first is very important at the beginning.

HOW?????
After found your purpose, then next step is use what method and strategy to reach your goal.

Different goal will need to apply different methods and strategy.

Income?
Accumulating Wealth?
Short term?
Mid term?
Long term?

Financial investment is something we use money to take risk for making more money.

I think this is a goal that everyone want to achieve it (making more money).

There are few ways to do analysis before make your decision such as:
Technical Analysis
Fundamental Analysis
Investment Psychology
Market Cycle
etc....

Today let us take a look on Sectors Vs Market Cycle:

Figure 1

Above figure is a roughly idea which sector is likely to pickup the up move in different market cycle stages.

When "big player" making money they will take profit, after take profit the funds will flow into another sector that got more space to earn more.

I need to make this clear to define where is beginning or ending is not an easy job. This needs continuous monitoring and tracking the market to find better opportunities.

There are many ways to do it. You just need to learn how to do it.

The more homework you do, the better chance to increase the probability of profit.

Hope this information will provide you some sight what to do in different market cycles.

Thank you for your reading.

Have a nice day.

Disclaimer:

All posts and documents submitted by the Admin in this blog are solely for open discussion and education purposes only. All recommendations and opinion provided by the Admin are solely for your consideration only and you should exercise your own judgment in forming your own investment  decision(s). Please also be informed that equity investment is risky and we recommend you to conduct sufficient searches for information in addition to referring our recommendations and/or opinion herein, prior to making an investment decision.

You should take full responsibility of your investment decision(s) and we accept no liability whatsoever for any direct or consequential loss arising from any use of our recommendations and/or opinion provided herein or any solicitations of an offer to buy or sell any securities. Comments and opinions forwarded/provided by members/followers of this blog do not belong to the Admin and we take no responsibility of such.

Friday, 11 September 2015

Buy Like A Fool, Sell Like A Pro

There are 4 scenarios that keep repeating during investment decision making, as below:
  1. Buy Like A Fool, Sell Like A Fool.
  2.  Buy Like A Pro, Sell Like A Fool.
  3. Buy Like A Pro, Sell Like A Pro.
  4. Buy Like A Fool, Sell Like A Pro.

So which method that you keep using?


Basically, Buy decision making got 2 types:

  1. Buy when the price near your estimated the best entry price or the entry price. (Pro)
  2. Buy when your felt comfortable after there is a bullish signal. (Fool)

When come to Sell decision making got 4 types:

  1. Sell when the price reached or exceeded your target price (Pro)
  2. Sell when the price failed to reach your target price with profit or breakeven. (Pro)
  3. Sell when the price failed to reach your target price with predetermined exit point. (Pro)
  4. Sell when the price failed to reach your target price with no planning. (Fool) 

After go through above scenarios and methods, what’s your choice now?


The best choice will be scenario 3 and 4, right?


Sometimes, we might missed the best entry price but it doesn’t means that we not going to earn money from the trade.

Example:


Airasia on 26/08/2015, the lowest price is RM0.765 then next day close at 0.885.

So will you buy Airasia if you know it will come to RM1.25 by 11/09/2015?

Definitely yes!


However, we are no god, we only can predict the price and follow the trend.

So would you forgo the 36.5sen in profit after you miss the best entry point and decided not buy at 0.885?

Think about this example whenever you spot an opportunity but you miss the best entry price.

Above example is intention to tell you that, we are not necessary to buy like a Pro but can buy like Fool.We can buy without a good planning or strategy but we need to sell like a Pro.

How many people losing huge money because of not having a good strategy to sell their share?

It should be majority of people having this kind of problems, only minorities that keep on track wining overall don’t have this kind of problems. By having a good sell strategies, help you secure you profit and save your capital.


Example:


Counter that drop fast and steeply:

Sumatec (on 21/08/2014) and Ideal (19/08/2014), these 2 counters bull at the way then dropped steeply in one day within few minutes.

Counter that drop slow and steady:

Knm (since Aug 2014) , Skpetro (since April 2014) and UMWOG (since Feb 2014), these 3 counters after bull then drop slowly.

Thanks for your reading.

Disclaimer:
All posts and documents submitted by the Admin in this blog are solely for open discussion and education purposes only. All recommendations and opinion provided by the Admin are solely for your consideration only and you should exercise your own judgment in forming your own investment decision(s). Please also be informed that equity investment is risky and we recommend you to conduct sufficient searches for information in addition to referring our recommendations and/or opinion herein, prior to making an investment decision.

You should take full responsibility of your investment decision(s) and we accept no liability whatsoever for any direct or consequential loss arising from any use of our recommendations and/or opinion provided herein or any solicitations of an offer to buy or sell any securities. Comments and opinions forwarded/provided by members/followers of this blog do not belong to the Admin and we take no responsibility of such.

Tuesday, 30 June 2015

How To Overcome Emotional

Can anyone cut loss easily?

No, it is very hard due to emotion of Hope and Ignorance.

What are the factors that caused investor not willing to cut loss?

- not willing to accept the fact of their losing
- losing their hard-earned money
- overconfidence
- paper loss is okay for them as long as the losses yet realized
- 5 days of contra period yet fully utilized

To overcome the emotional of Hope and Ignorance as per below:

- having the correct mindset/ideology
- trade according trading rules

Mindset/Ideology


Mindset 1: Cut loss is a must.

Mindset 2: Cut loss at higher price so we can buy back more quantity with lower price with the residual capital.

Mindset 3: Cut loss is a capital protection.


Example:


You bought ABC shares at point A RM0.50 10,000units, total RM5,000.00 (excluded charges). At the same time, you don't have extra cash to average down.

Scenario 1: Never cut loss.


When share price dropped 5% to the red line RM0.475, you continued hold without a cut loss strategy. (Paper loss RM250.00)

However, the share price yet rebound and dropped 20% from RM0.50 to point B RM0.40, your paper loss getting more and more. (Paper loss RM1000.00)

During RM0.40, do you have extra cash to buy in when you saw a rebound started at point B?

No, you don't have as you didn't cut loss earlier.

At the end, you sold at point C RM0.450. (Loss RM500.00)

Overall: -RM500 (NET LOSS)

Scenario 2: With cut loss strategy.


When share price dropped 5% to the red line RM0.475, you cut loss and get back RM4,750.00. (Loss RM250)

As the share price continued dropped to RM0.400, it doesn't matter as you had CUT LOSS and done your CAPITAL PROTECTION.

During RM0.400, you reenter with all RM4,750.00 and able to buy 11,800units.

When the share price reached RM0.450 and you sold it. (Profit RM590)

Overall: RM590 - RM250 = RM340 (NET PROFIT) 

Summary


From above example, can you see how cut loss can save you from huge losses at the same time it provides the opportunity to cover back the losses incurred with profit.

Trading Rules


What are trading rules?

Trading rules are a guideline for you to buy and sell (take profit or cut loss).

Trading rules can be mixture of fundamental analysis (financial ratio, performance etc..), technical analysis (technical indicator signal, price movement etc...) and money management.

Every investor has different trading rules.

Example for money management trading rules:

Take profit if price up 30% from entry point.

Cut loss if price drop 10% from entry point.

Summary


In short, once you set your own trading rules then follow it and never goes against it. 


Conclusion


When you having the right mindset with trading rules then emotional getting far from you and to achieve "WIN BIG, LOSS SMALL" is no longer a dream.

Thanks for your reading.

Hope above information is useful for you.

Disclaimer:

All posts and documents submitted by the Admin in this blog are solely for open discussion and education purposes only. All recommendations and opinion provided by the Admin are solely for your consideration only and you should exercise your own judgment in forming your own investment decision(s). Please also be informed that equity investment is risky and we recommend you to conduct sufficient searches for information in addition to referring our recommendations and/or opinion herein, prior to making an investment decision.

You should take full responsibility of your investment decision(s) and we accept no liability whatsoever for any direct or consequential loss arising from any use of our recommendations and/or opinion provided herein or any solicitations of an offer to buy or sell any securities. Comments and opinions forwarded/provided by members/followers of this blog do not belong to the Admin and we take no responsibility of such

Wednesday, 24 June 2015

Money Management: How much capital should you invest per trade?

Money management is a very important skill in stock investment.

Today, we going to share a method to calculate the investment capital per trade.

Will it be hard?

No, it is easy as ABC by using a mathematics formula.

Capital = (Amount that you willing to lose per trade)/(Your risk profile per trade)

Example:

Amount willing to lose per trade = RM500

Your risk profile per trade = 10% = 0.1

Now lets input the parameters into for above formula.

Capital = 500/0.1 = 5000

Therefore, $5000 will be the best capital amount to invest per trade based on your own risk profile.

Easy, right?

In short, by having a good money management skill helps to avoid doing overvalue trading and know when to cut loss to protect your capital.

Thanks for your reading.

Hope above information is useful for you
.

Disclaimer:

All posts and documents submitted by the Admin in this blog are solely for open discussion and education purposes only. All recommendations and opinion provided by the Admin are solely for your consideration only and you should exercise your own judgment in forming your own investment decision(s). Please also be informed that equity investment is risky and we recommend you to conduct sufficient searches for information in addition to referring our recommendations and/or opinion herein, prior to making an investment decision.


You should take full responsibility of your investment decision(s) and we accept no liability whatsoever for any direct or consequential loss arising from any use of our recommendations and/or opinion provided herein or any solicitations of an offer to buy or sell any securities. Comments and opinions forwarded/provided by members/followers of this blog do not belong to the Admin and we take no responsibility of such.


Saturday, 6 June 2015

Basic of Technical Analysis: Set SUPPORT and RESISTANCE level

Why support and resistance level must be set correctly?

Explanation:
1. To trigger buy and sell decision making.
2. To predict the price movement.

Let's go through a stock price chart, I picked YTL as the example.

After looking at the chart, what do you discover?

You should found out that when the price in uptrend and rise to certain price level then the price starts to drop.

So same to the drop case, when the price in downtrend and drops to certain price level then the price will starts to go up again.

Let's highlight the maximum point and minimum point of the uptrend and downtrend as per below picture.


Easy, right?

All the peaks and lows that being highlighted can be Support and Resistance level.

However, if we draw all the horizontal lines at these points will make the chart very messy.

The most important point here is the more the peaks and the lows touch the same horizontal line then that line will be the significant or important Support and Resistance level.

Next step, draw a horizontal line where it can links with the most maximum point and minimum point.


The horizontal line that links with the maximum point called Resistance level.
Support level is the horizontal line that links with the minimum point.

Now, do you know when to buy and sell?

Can you predict the price movement?

Thank you for your reading.

Disclaimer:

All posts and documents submitted by the Admin in this blog are solely for open discussion and education purposes only. All recommendations and opinion provided by the Admin are solely for your consideration only and you should exercise your own judgment in forming your own investment decision(s). Please also be informed that equity investment is risky and we recommend you to conduct sufficient searches for information in addition to referring our recommendations and/or opinion herein, prior to making an investment decision.

You should take full responsibility of your investment decision(s) and we accept no liability whatsoever for any direct or consequential loss arising from any use of our recommendations and/or opinion provided herein or any solicitations of an offer to buy or sell any securities. Comments and opinions forwarded/provided by members/followers of this blog do not belong to the Admin and we take no responsibility of such.


Sunday, 3 May 2015

Basic for Stock Investment


Own a Trading Account and CDS Account
  • You must have above two accounts before start to trade stock(s).
  • Visit your nearest Share Trading Centre/Participating Organisation (PO) to open these two accounts.
List of Broker: Ame Securities, HLeBroking, Jupiter Securities, Maybank, M+ Online, RHB, UOB KayHian etc...

Set your Investment Objective
  • Income - Dividend
  • Income & Growth - Dividend & Capital Gain
  • Growth - Capital Gain
  • Trading & Speculation - Capital Gain
Discover your Risk Profile
  • Income - Low Risk
  • Income & Growth - Low to Medium Risk
  • Growth - Medium to High Risk
  • Trading & Speculation - High Risk
Money Management


Stock Analysis


Basic Chart Information
  • Candlestick
  • Line
  • OHLC


Strategies
  • Profit taking
  • Secure Profit
  • Breakeven
  • Cut loss


Emotional - Caused 80% of investors lose money
  • Fear - Scare and in-confident that lead to wrong decision making.
  • Greedy -  Expecting the investment value will go higher than current value but forgotten Rome doesn't built in one day.
  • Hope -  Miracle doesn't occurs everyday.
  • Ignorance - Ignore negative trend and buy more.

Useful Website for Stock Investment
  • I3investor - a free and independent stock investors portal
  • Malaysia Stock.Biz
  • BursaMKTPLC
  • The Edge Markets
  • tradeSignum: Bursa Malaysia stock market news, analysis ...
  • Bursa Malaysia
  • klse.my

Thanks for your reading.

Hope above information is useful for you.


Disclaimer:

All posts and documents submitted by the Admin in this blog are solely for open discussion and education purposes only. All recommendations and opinion provided by the Admin are solely for your consideration only and you should exercise your own judgment in forming your own investment decision(s). Please also be informed that equity investment is risky and we recommend you to conduct sufficient searches for information in addition to referring our recommendations and/or opinion herein, prior to making an investment decision.


You should take full responsibility of your investment decision(s) and we accept no liability whatsoever for any direct or consequential loss arising from any use of our recommendations and/or opinion provided herein or any solicitations of an offer to buy or sell any securities. Comments and opinions forwarded/provided by members/followers of this blog do not belong to the Admin and we take no responsibility of such.