Wednesday, 29 April 2020

Good Signal Vs Bad Signal (Fake Signal)

Many people do well in up market but not very well during down market.

Do you ever think why is this happening?

In technical analysis, one of the main pillar is market moves in trend.

From this aspect, we need to know market is uptrend, downtrend or sideway.

Why many people do well in up market?

Because during up market, up space is more than down space.


Figure 1

Green colour vertical line represent the up movement price distance.

Red colour vertical line represent the down movement price distance.

During uptrend, up movement price distance is MORE THAN down movement price distance.

Green line is LONGER than Red line.

While for down market, down space is more than up space.
Figure 2

During downtrend, up movement price distance is LESS THAN down movement price distance.

Green line SHORTER than Red line.

When you understand the characteristics of trend, then you can save lots of money.


Next let's see Good signal vs Bad signal.

During uptrend, many indicator give good signal and good entry.

Below example is used the most widely used indicator RSI.


Chart 1

For chart 1, RSI given 3 oversold signals if buy at that moment which are 100% winning rate as after entered position price start to move up.

In uptrend, you can blindly follow the indicator buy signal and mostly can earn profit without much problems.

This is because up space more than down space.


However when come to downtrend market, indicator buy signal can be a nightmare.


Chart 2

In this downtrend chart, RSI got 8 oversold signals. If we followed all these buy signals, got 5 signals after entered position price still moving down and some of them evening move down steeply.

3 of  8 buy signals can earn profit.

5 of  8 buy signals is Bad signal or so called FAKE SIGNAL which can make you lose money.

Therefore, many buy signals from indicators work well in uptrend but not in downtrend.

If you know when to buy and when NOT TO BUY, your stock return would be awesome.

Learn how to see the trend and follow the trend.

Hope this can help you improve your stock return on investment and avoid the TRAP.

To join our telegram channel, click below link
https://t.me/MasketeerTafaInvest

Like us on FB:
https://www.facebook.com/MasketeerTafaInvest/

Thank you for your reading.

Have a nice day.

Disclaimer:

All posts and documents submitted by the Admin in this blog are solely for open discussion and education purposes only. All recommendations and opinion provided by the Admin are solely for your consideration only and you should exercise your own judgement in forming your own investment decision(s). Please also be informed that all kind of investments have risks and we recommend you to conduct sufficient searches for information in addition to referring our recommendations  and/or opinion herein, prior to making any investment decision.

You should take full responsibility of your investment decision(s) and we accept no liability whatsoever for any direct or consequential loss arising from any use of our recommendations and/or opinion provided herein or any solicitations of an offer to buy or sell any securities. Comments and opinions forwarded/shared/provided by members/followers/readers of this blog do not belong to Admin and we take no responsibility of such.

Saturday, 25 April 2020

Less than 10 Seconds Stock Checking Method

There are plenty of ways to check a stock is good or not.

Some of those ways need lots of experience and efforts before you can really apply it efficiently. 

Fortunately, there is a most easier way to check your stock with less than 10 secs time.

Before you want to use this method, you need to have access to stock price chart.

There are many platforms you can access to see stock price chart.

Example:
including your broker platform charting system

Today we will show you how to access to a stock price chart and check your stock within 10 seconds.

We going to use google to do it.

1st Step:

If you holding a share, example Facebook Inc.

Just go to www.google.com and search the company share price.

For Facebook Inc., just type "Facebook Share Price"

Figure 1

2nd Step:

Click "Max" after you see the share price chart.

Figure 2

3rd Step:

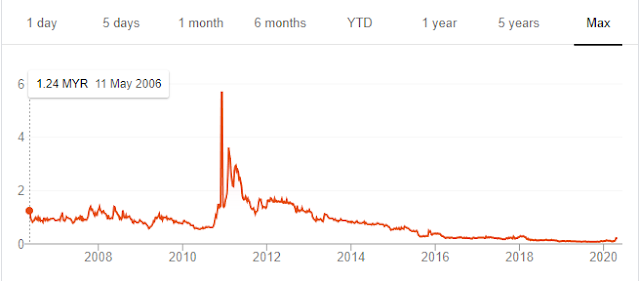
After clicked "Max", the chart will shows the share price from beginning until latest price.

Figure 3

Easy right?

Now let us see some stock price chart examples.


Chart 1


Chart 2


Chart 3

Based on above 3 Charts, which stock will you choose to buy, sell or hold.

This is EASY right?

Now if you holding a stock that is same as Chart 1, what should you do?

If you looking a stock which similar with Chart 2, would you invest in it?

So now everything is very clear, right?

Without referring to pro, you also know what to do.

Hope this will give a you clear direction.

Thank you for you reading.

Have a nice day.

Disclaimer:

All posts and documents submitted by the Admin in this blog are solely for open discussion and education purposes only. All recommendations and opinion provided by the Admin are solely for your consideration only and you should exercise your own judgment in forming your own investment  decision(s). Please also be informed that equity investment is risky and we recommend you to conduct sufficient searches for information in addition to referring our recommendations and/or opinion herein, prior to making an investment decision.

You should take full responsibility of your investment decision(s) and we accept no liability whatsoever for any direct or consequential loss arising from any use of our recommendations and/or opinion provided herein or any solicitations of an offer to buy or sell any securities. Comments and opinions forwarded/provided by members/followers of this blog do not belong to the Admin and we take no responsibility of such.

Thursday, 23 April 2020

Common Question: "What stock to buy?"

Today let us discuss about this question that we can heard about it all the time.

When come to financial instruments, we need to know: why to use it and how to use it.

WHY??????
What is your intention of using this financial instrument to make money?
Trading?
Investment?
We must have a clear mind about this before enter the market.
So know your purpose first is very important at the beginning.

HOW?????
After found your purpose, then next step is use what method and strategy to reach your goal.

Different goal will need to apply different methods and strategy.

Income?
Accumulating Wealth?
Short term?
Mid term?
Long term?

Financial investment is something we use money to take risk for making more money.

I think this is a goal that everyone want to achieve it (making more money).

There are few ways to do analysis before make your decision such as:
Technical Analysis
Fundamental Analysis
Investment Psychology
Market Cycle
etc....

Today let us take a look on Sectors Vs Market Cycle:

Figure 1

Above figure is a roughly idea which sector is likely to pickup the up move in different market cycle stages.

When "big player" making money they will take profit, after take profit the funds will flow into another sector that got more space to earn more.

I need to make this clear to define where is beginning or ending is not an easy job. This needs continuous monitoring and tracking the market to find better opportunities.

There are many ways to do it. You just need to learn how to do it.

The more homework you do, the better chance to increase the probability of profit.

Hope this information will provide you some sight what to do in different market cycles.

Thank you for your reading.

Have a nice day.

Disclaimer:

All posts and documents submitted by the Admin in this blog are solely for open discussion and education purposes only. All recommendations and opinion provided by the Admin are solely for your consideration only and you should exercise your own judgment in forming your own investment  decision(s). Please also be informed that equity investment is risky and we recommend you to conduct sufficient searches for information in addition to referring our recommendations and/or opinion herein, prior to making an investment decision.

You should take full responsibility of your investment decision(s) and we accept no liability whatsoever for any direct or consequential loss arising from any use of our recommendations and/or opinion provided herein or any solicitations of an offer to buy or sell any securities. Comments and opinions forwarded/provided by members/followers of this blog do not belong to the Admin and we take no responsibility of such.

Tuesday, 21 April 2020

Market Outlook KLCI & DJIA, Date: 21/04/2020


Technical view on KLCI:

Recently, KLCI moving up together with the global market indices.
Since 30 December 2019, KLCI moving down and broke the sideway support line at 1551 then move down steeply within 2 months time.

Yesterday 20 APR2020, MACD just managed to break above zero level to move into positive region. Unfortunately, today 21 APR 2020 at the mid day break of the market, the MACD crosses below zero again.

Recent market upward movement, we see it as a rebound instead of uptrend. There is a significant resistance level at 1560. Currently, KLCI is in between the Fibonacci Retracement level 38.2% and 61.8%. Next support level is at 1360.

The vertical blue line is the estimation turning point or acceleration point, when come near these date need to monitor closely. The date is 23 APR 2020, 2 days to go.


Technical view on DJIA:

After a big drop, DJIA moving up since 24 MAR 2020.

On last Friday 17 APR 2020, MACD reading go above zero which is a positive sign but market does not seem to be hold on the positive momentum.

Same view from above, we see this as a rebound instead of uptrend. There is significant resistance level at 27100.

At the moment, DJIA also still in the area between Fibonacci Retracement level 38.2% and  61.8%.

The vertical blue line is the estimation turning point or acceleration point, when come near these date need to monitor closely. The next date is 28 APR 2020, 7 days to go.

In short, market not yet uptrend. PLEASE WATCH OUT!!!

Thank you for your reading.

Disclaimer:

All posts and documents submitted by the Admin in this blog are solely for open discussion and education purposes only. All recommendations and opinion provided by the Admin are solely for your consideration only and you should exercise your own judgment in forming your own investment  decision(s). Please also be informed that equity investment is risky and we recommend you to conduct sufficient searches for information in addition to referring our recommendations and/or opinion herein, prior to making an investment decision.

You should take full responsibility of your investment decision(s) and we accept no liability whatsoever for any direct or consequential loss arising from any use of our recommendations and/or opinion provided herein or any solicitations of an offer to buy or sell any securities. Comments and opinions forwarded/provided by members/followers of this blog do not belong to the Admin and we take no responsibility of such.